Filed by GTWY Holdings Limited pursuant to

Rule 425 under the Securities Act of 1933

and deemed filed pursuant to Rule 14a-12

under the Securities Exchange Act of 1934

Subject Company: Leisure Acquisition Corp.

Commission File No.: 001-38306


LOGO

Investor Presentation
January 2020


LOGO

Disclaimer
GENERAL
This presentation does not constitute an offer or invitation for the sale or purchase of securities and has been prepared solely for informational purposes.
The information contained in this presentation (the “Presentation”) has been prepared to assist interested parties in making their own evaluation with respect to the proposed transaction (the “Transaction”) between Leisure Acquisition Corp. (“LACQ”) and GTWY Holdings Limited (together with Gateway Casinos & Entertainment Limited, “Gateway” or the “Company”), and for no other purpose. This Presentation is subject to updating, completion, revision, verification and further amendment. None of LACQ, Gateway, or their respective affiliates has authorized anyone to provide interested parties with additional or different information. No securities regulatory authority has expressed an opinion about the securities discussed in this Presentation and it is an offence to claim otherwise. The information contained herein does not purport to be all-inclusive. Nothing herein shall be deemed to constitute investment, legal, tax, financial, accounting or other advice.
In this Presentation, all amounts are in Canadian dollars, unless otherwise indicated. All references to US$ are based on the relevant exchange rate as at December 26, 2019. Any graphs, tables or other information in this Presentation demonstrating the historical or pro forma performance of Gateway or any other entity contained in this Presentation are intended only to illustrate past performance of such entities and are not necessarily indicative of future performance of Gateway or such entities.
ADDITIONAL INFORMATION AND WHERE TO FIND IT
This presentation relates to a proposed transaction between Gateway and LACQ. This presentation does not constitute an offer to sell or exchange, or the solicitation of an offer to buy or exchange, any securities, nor shall there be any sale of securities in any jurisdiction in which such offer, sale or exchange would be unlawful prior to registration or qualification under the securities laws of any such jurisdiction. Gateway intends to file a registration statement on Form F-4 with the SEC, which will include a document that serves as both a prospectus, and as a proxy statement of LACQ, referred to as a proxy statement/prospectus. A proxy statement/prospectus will be sent to all LACQ shareholders. LACQ also will file other documents regarding the proposed transaction with the SEC. Before making any voting decision, interested parties and security holders of LACQ are urged to read the registration statement, the proxy statement/prospectus and all other relevant documents filed or that will be filed with the SEC in connection with the proposed transaction as they become available in their entirety because they will contain important information about the proposed transaction.
Interested investors and security holders of LACQ will be able to obtain free copies of the registration statement, the proxy statement/prospectus and all other relevant documents filed or that will be filed with the SEC by LACQ and the Company through the website maintained by the SEC at www.sec.gov.
In addition, copies of the documents filed with the SEC by LACQ and/or the Company, when available, can be obtained free of charge on LACQ’s website at www.leisureacq.com or by directing a written request to Leisure Acquisition Corp., 250 West 57th Street, Suite 2223, New York, New York 10107 or by emailing George.Peng@hydramgmt.com; and/or on the Company’s website at www.gatewaycasinos.com or by directing a written request to GTWY Holdings Limited, 100-4400 Dominion Street, Burnaby, British Columbia V5G or by emailing gtwy@jcir.com.
PARTICIPANTS IN SOLICITATION
LACQ, Gateway and their respective directors and executive officers may be deemed to be participants in the solicitation of proxies from LACQ’s shareholders in connection with the proposed transaction. Information about LACQ’s directors and executive officers and their ownership of LACQ’s securities is set forth in LACQ’s definitive proxy statement on Schedule 14A filed with the SEC on October 28, 2019. Additional information regarding the interests of those persons and other persons who may be deemed participants in the proposed transaction may be obtained by reading the proxy statement/prospectus regarding the proposed transaction when it becomes available. You may obtain free copies of these documents as described in the preceding paragraph.
INDUSTRY AND MARKET DATA
This Presentation has been prepared by Gateway and includes market data and other statistical information from third-party sources, including provincial gaming authorities. Although LACQ and the Company believes these third-party sources are reliable as of their respective dates, none of LACQ, the Company, or any of their respective affiliates has independently verified the accuracy or completeness of this information. Some data are also based on the Company’s good faith estimates, which are derived from both internal sources and the third-party sources described above. None of LACQ, Gateway, any third-party source providing market data and statistical information, their respective affiliates, nor their respective directors, officers, employees, members, partners, shareholders or agents make any representation or warranty with respect to the accuracy of such information (including information from third-party sources).


LOGO

Disclaimer (cont’d)
FORWARD-LOOKING INFORMATION
This Presentation contains “forward-looking information” within the meaning of applicable securities laws in Canada and the United States. Forward-looking statements may relate to Gateway’s, LACQ’s, or the combined company’s future financial outlook and anticipated events or results and may include information regarding our financial position, business strategy, growth strategies, growth objectives, budgets, operations, financial results, taxes, dividend policy, regulatory developments, plans and objectives. All statements other than statements of historical fact are forward-looking statements. The use of any of the words “anticipate”, “plan”, “contemplate”, “continue”, “estimate”, “expect”, “intend”, “propose”, “might”, “may”, “will”, “shall”, “project”, “should”, “could”, “would”, “believe”, “predict”, “forecast”, “pursue”, “potential” and “capable” and similar expressions are intended to identify forward looking statements. Forward-looking statements involve known and unknown risks, uncertainties and other factors that may cause actual results or events to differ materially from those anticipated in such forward-looking statements. In addition, this Presentation may contain forward-looking statements attributed to third party industry sources, the accuracy of which has not been verified by LACQ or Gateway. No assurance can be given that these expectations will prove to be correct and such forward-looking statements included in this Presentation should not be unduly relied upon. Statements containing forward-looking information are not historical facts but instead represent management’s expectations, estimates and projections regarding future events or circumstances. Forward-looking information contained in this Presentation and other forward-looking information are based on our opinions, estimates and assumptions in light of our experience and perception of historical trends, current conditions and expected future developments, as well as other factors that we currently believe are appropriate and reasonable in the circumstances. Despite a careful process to prepare and review the forward-looking information, there can be no assurance that the underlying opinions, estimates and assumptions will prove to be correct.
Additionally, any estimates and projections contained herein have been prepared by the management of the Company and involve significant elements of subjective judgment and analysis, which may or may not be correct. This Presentation includes certain estimates, targets and projections that reflect Gateway management’s assumptions concerning anticipated future performance of Gateway as provided to LACQ on December 19, 2019. Such estimates, targets and projections from are based on significant assumptions and subjective judgments concerning anticipated results, which are inherently subject to risks, variability and contingencies, many of which are beyond Gateway’s control. These assumptions and judgments may or may not prove to be correct and there can be no assurance that any projected results are attainable or will be realized. LACQ, Gateway, any third-party source providing information and each of their respective representatives disclaims any and all liability for any loss or damage (whether foreseeable or not) suffered or incurred by any person or entity as a result of anything contained or omitted from this Presentation (including information from third-party sources) and such liability is expressly disclaimed.
You are cautioned not to place undue reliance on any forward-looking statements, which speak only as of the date of this Presentation. The forward-looking information contained in this Presentation represents our expectations as of the date of this Presentation or the date indicated, regardless of the time of delivery of the Presentation and is subject to change after such date. However, we disclaim any intention or obligation or undertaking to update or revise any forward-looking information whether as a result of new information, future events or otherwise, except as required by law.
All of the forward-looking information contained in this Presentation is expressly qualified by the foregoing cautionary statements.
NON-IFRS MEASURES
This Presentation makes reference to certain financial and other measures commonly used by financial analysts in evaluating the financial performance of companies and by the Company’s management in evaluating its operations, including companies in the gaming industry that are not presented in accordance with international financial reporting standards (“IFRS”). These measures are not recognized measures under IFRS and do not have a standardized meaning prescribed by IFRS and are therefore unlikely to be comparable to similar measures presented by other companies. Rather, these measures are provided as additional information to complement those IFRS measures by providing further understanding of our results of operations from management’s perspective. Accordingly, these measures should not be considered in isolation nor as a substitute for analysis of our financial information reported under IFRS.
We use non-IFRS measures including “Adjusted EBITDA”, “Adjusted EBITDA Margin”, “Adjusted Property EBITDA”, “Adjusted Property EBITDA Margin”, “EBITDA”, “Free Cash Flow”, “Free Cash Flow Conversion”, and “Pro Forma Adjusted EBITDA” and these measures should not be considered as an alternative to net income (loss), earnings per share or any other performance measures derived in accordance with IFRS as measures of operating performance, operating cash flows or as measures of liquidity. For further details on these non-IFRS measures including relevant definitions and reconciliations, see the “Financial Overview” section of this Presentation.
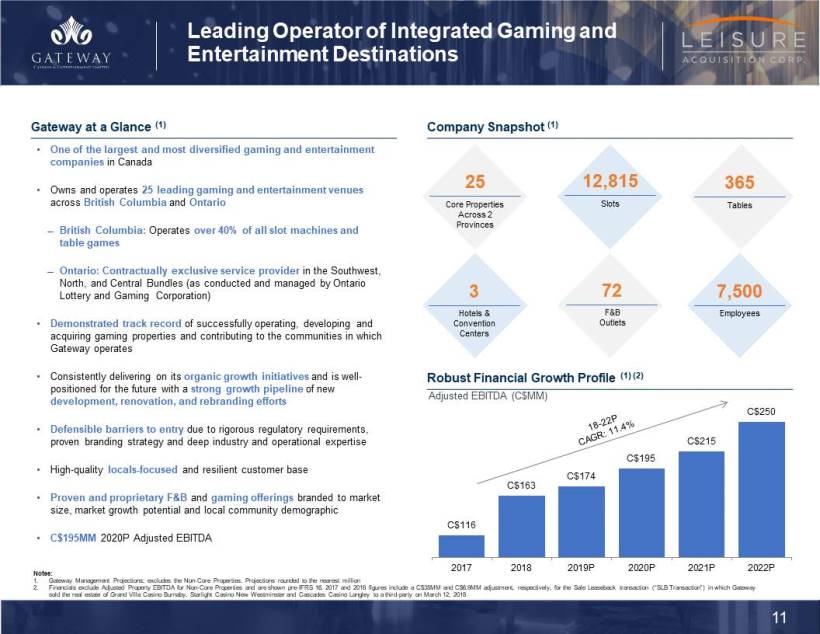
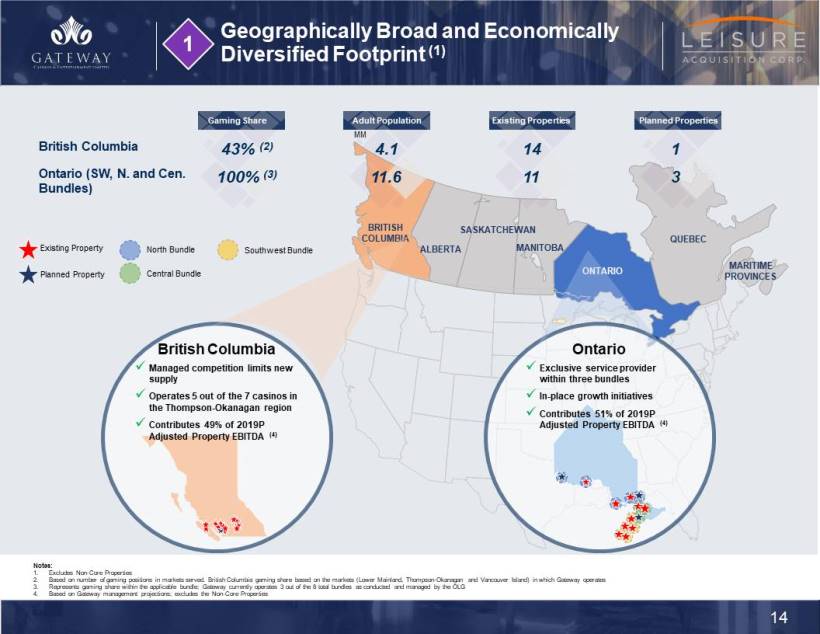
As of September 30, 2019, Starlight Casino Edmonton and Grand Villa Casino Edmonton are considered discontinued operations in Gateway’s consolidated financial statements. These properties are referred to in this presentation as “Non-Core Properties.” Where indicated in this presentation, financial information of Gateway excludes the Non-Core Properties.
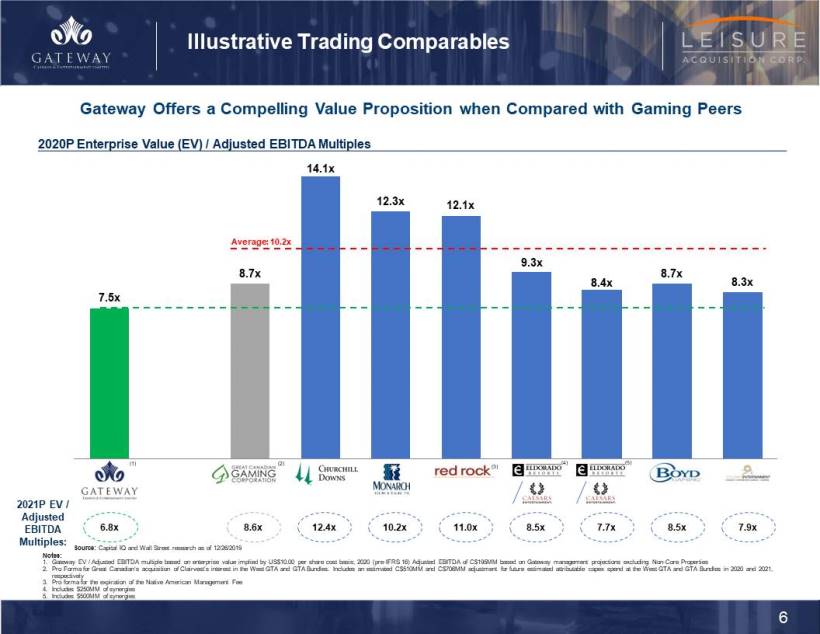
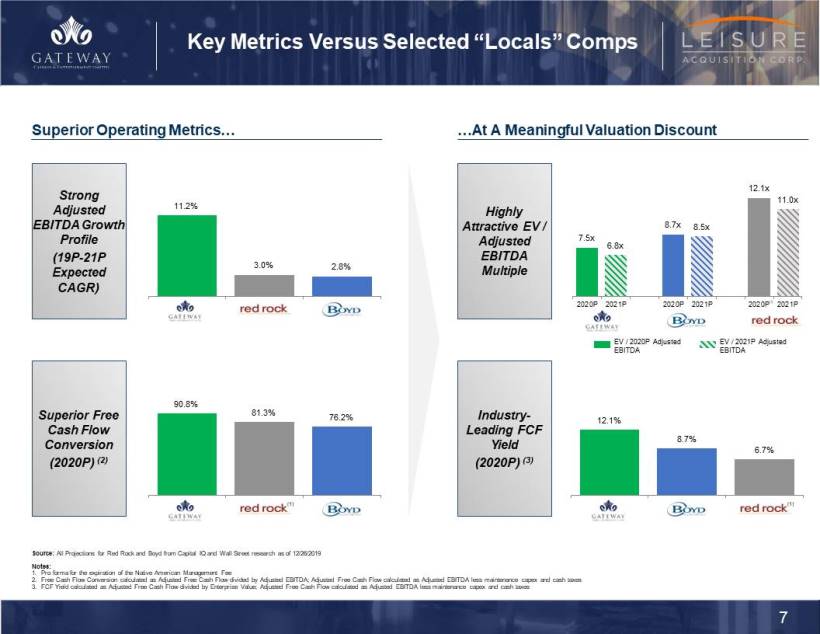
COMPARABLE COMPANIES
Certain information presented herein compares the Company to other issuers and such data sets are considered to be “comparables”. The information is a summary of certain relevant operational attributes of certain gaming issuers and has been included to provide interested parties an overview of the performance of what are expected to be comparable issuers. These issuers are in the same industry, provide similar services and operate in similar regulatory environments and each should be considered an appropriate basis for comparison to the Company. The information regarding the comparables was obtained from public sources, has not been verified by LACQ, the Company, or any of their respective affiliates and if such information contains a misrepresentation, interested parties do not have a remedy under securities legislation in any province or territory of Canada. There are risks associated with comparables, including the integrity of the underlying information and the ability to isolate specific variables which may impact one issuer and not another. There are risks associated with making investment decisions based on comparables including whether data presented provides a complete comparison between issuers. Interested parties are cautioned that past performance is not indicative of future performance and the performance of the Company may be materially different from the comparable issuers. Accordingly, an investment decision should not be made in reliance on the comparables.


LOGO

Gateway Casinos & Entertainment
A Leading Operator of Integrated Gaming and Entertainment Destinations Across Canada


LOGO

Presenters
Gabriel de Alba
Executive Chairman of
Gateway Casinos
Managing Director and Partner at Catalyst Capital, the majority owner of Gateway Casinos
Currently serves as and will continue to serve as Gateway’s Executive Chairman post-transaction
Since acquiring Gateway in 2010, Catalyst Capital and Mr. de Alba have been instrumental in the Company’s growth strategies, acquisitions, renovations and rebranding initiatives
Prior to joining Catalyst Capital at its inception in 2002, worked at AT&T Latin America, was a founding member of Bank of America International Merchant Banking Group and, prior to that, worked in Bankers Trust’s Merchant Banking Group
Holds a double B.S. in Finance and Economics from NYU Stern School of Business, MBA from Columbia University and has completed graduate courses in Mathematics, Information Technology and Computer Sciences at Harvard
Lorne Weil
Executive Chairman of Leisure Incoming Vice Chairman
Renowned leader in gaming sector
Considerable transactional and operational experience focused on gaming and leisure sectors
Executive leader overseeing successful growth of Scientific Games and Inspired Entertainment
Led prior SPACs through successful acquisitions and integration
Received undergraduate degree in Economics from University of Toronto, MSc from the London School of Economics and MBA from Columbia Business School where he was a member of the Board of Overseers for 10 years
Daniel Silvers
CEO of Leisure Incoming Vice Chairman
Long-time gaming sector operator and investor
Investment banking and direct investing experience focused on gaming and leisure
Accomplished Executive and Director with ability to navigate complex and uncertain environments
Executive leader and/or director of multiple SPAC successor entities
Led prior SPACs through successful acquisitions and integration
Holds a B.S. in Economics (concentrations in Finance and Accounting) from The Wharton School at the University of Pennsylvania, MBA from The Wharton School at the University of Pennsylvania and has completed a director’s education program at the Anderson School at UCLA
Tony Santo
Current President and CEO
President and CEO of Gateway Casinos since Oct. 2013
Shortly following completion of the transaction, Mr. Santo will retire from the Company; he will serve as an advisor to the Board of Directors and Mr. Falcone for 3 months thereafter to ensure a smooth transition
President and CEO of Santo Gaming LLC from 2007-2013
Previously served as Senior VP of Operations, Products and Services for Harrah’s Entertainment and Senior VP of Western and Mid-South Regions for Caesars
Bachelor of Science Degree in Hotel Admin. at the Univ. of Nevada, Las Vegas
Marc Falcone
To Become President and CEO
Current Director of Leisure
To become President and CEO shortly following completion of the transaction
Extensive experience in the gaming and leisure sectors in both corporate and financial advisory roles
Currently serves as President and CFO of Sightline Payments LLC since Feb. 2019 and as a member of LACQ’s Board of Directors since Dec. 1, 2017
Previously served as CFO and Treasurer of Red Rock Resorts and Station Casinos (Jun. 2011 – May 2017)
Previously served as CFO of Fertitta Entertainment (Oct. 2010 – May 2016)
Holds a B.S. from Cornell University (concentrations in Hospitality Real Estate Finance and Food & Beverage)
Queenie Wong
Chief Accounting Officer
Appointed Chief Accounting Officer in Jan. 2020; Served as Senior VP, Finance since Mar. of 2018
Prior to her role as Senior VP, served as VP, Finance from Jul. of 2016 to Feb. 2018 and as Director, Finance from Aug. 2011 to Jul. 2016
Previously a Senior Manager at Pricewaterhouse Coopers LLP
Chartered Professional Accountant (CPA-CA); Bachelor of Commerce from Univ. of British Columbia


LOGO

Section 1
Transaction Overview


LOGO

Transaction Summary (1)
Transaction Structure
Leisure Acquisition Corp. (“LACQ”) to merge with a wholly-owned subsidiary of GTWY Holdings Limited (“GTWY”), the parent holding company and sole shareholder of Gateway Casinos, with LACQ shareholders / warrant holders to receive GTWY common shares / warrants upon the merger
GTWY common shares expected to be listed on the NYSE upon consummation of the transaction, with GTWY qualifying as a foreign private issuer
Valuation
US$1.1Bn (C$1.5Bn) pro forma enterprise valuation
7.5x 2020 Projected Adjusted EBITDA (2)
Funding Sources
US$30MM equity commitment from HG Vora Capital Management LLC (“HG Vora”); including existing invested capital, HG Vora’s total capital commitment to the Company is in excess of US$100MM (3)
Up to US$189MM LACQ Trust rollover proceeds (4)
Gateway shareholders rollover
Contingent Consideration
Existing Gateway shareholders eligible to receive an earn-out of 1.898 million and 2.846 million shares that vest upon GTWY stock trading at greater than $12.50 and $15.00 per share over a 2 and 3 year period, respectively
18.975 million newly-issued warrants (equal tranches struck at US$11.50, US$12.50 and US$15.00 per share) issued to existing Gateway shareholders, to align incentives. Existing private warrants held by LACQ insiders and HG Vora (and HG Vora private warrants from equity commitment) to be amended to be equal tranches struck at US$11.50, US$12.50 and US$15.00
1.281 million options issued to certain members of management in the same proportion and equivalent term and conditions as the earn-out payment and the warrants being issued to existing shareholders of Gateway
Required Approvals
LACQ and GTWY shareholder approval, gaming regulatory approvals and contractual approvals from Crown agencies
Registration statement and approval for listing on NYSE
Management and Independent Board
Marc Falcone expected to become President and CEO of Gateway shortly following completion of the transaction
Lorne Weil, Daniel Silvers, Marc Falcone, Lyle Hall, Olga Ilich and Dr. Michael Percy are expected to join Gateway’s Board and Gabriel de Alba will continue to serve as Gateway’s Executive Chairman
Two additional independent directors will be appointed at or following the completion of the transaction such that Gateway’s Board will be comprised of up to 9 members
Other
The two Edmonton properties (Starlight Casino Edmonton and Grand Villa Casino Edmonton) are considered discontinued operations and are contemplated as being carved-out from the transaction (the “Non-Core Properties”)
All numbers presented in this presentation exclude the Non-Core Properties unless otherwise noted
Notes:
1. Figures converted from USD to CAD at an exchange ratio of 1.3122 as of 12/26/19
2. Based on 2020P (pre-IFRS 16) Adjusted EBITDA of C$195MM as provided by Gateway management, excluding the impact of the Non-Core Properties. The 7.5x transaction multiple is shown before any LACQ and/or shared fees and expenses. To the extent Gateway’s shareholders pay LACQ’s fees and expenses, shares issued to the existing Gateway shareholders shall increase on a pro rata basis by the amount of LACQ’s fees paid by Gateway’s shareholders
3. Includes existing investment in GTWY Holdings loan
4. US$11.2MM redeemed on 11/26/2019; LACQ trust account includes US$10MM of proceeds from HG Vora
3


LOGO

Transaction Summary (cont’d)
Sources and Uses (1) (2)
Pro Forma Capitalization (1) (2) (3)
Pro Forma Ownership (7)
Notes:
1. Assumes no SPAC redemptions beyond US$11.2MM redeemed on 11/26/2019; excludes shared expenses
2. Figures converted from USD to CAD exchange ratio of 1.3122 as of 12/26/19
3. Assumes full roll of HG Vora US$10MM Public Float
4. Represents gross cash proceeds to existing Gateway shareholders prior to the payment of any transaction fees or management incentive payments; to the extent Gateway’s shareholders pay LACQ’s fees, shares issued to Gateway shareholders will be increased on a pro rata basis by the amount of LACQ’s fees paid by Gateway’s shareholders
5. Balance as of 12/31/2019 as projected by Gateway Management
6. Transaction fees shown net of illustrative accrued interest available in LACQ Trust
7. Pro Forma Ownership represents ownership at close before the exercise of warrants and vesting of earn-outs and options
8. Catalyst and other current Gateway shareholders to be allocated 1MM founder shares pro rata from members of LACQ Management
9. Adjusted EBITDA projections as provided by Gateway management (pre-IFRS 16) excluding Adjusted Property EBITDA from the Non-Core Properties
10. Leverage stats include C$82MM letters of credit; based on 2020P and 2021P Adjusted EBITDA of C$195MM and C$215MM, respectively
4


LOGO

Anticipated Transaction Timeline
December 2019
Transaction Agreement Executed and Announced
First Quarter 2020
Preliminary Proxy Materials Filed with the SEC
Set Record Date for Shareholder Vote
Expected Mailing of Final Proxy Materials to Shareholders
Second Quarter 2020
Expected Receipt of Regulatory Approval and Contractual Approval from Crown Agencies
Hold Shareholder Vote and Anticipated Close of Transaction
Note: Estimated timeline based on current information and is subject to change
5


LOGO

Illustrative Trading Comparables
Gateway Offers a Compelling Value Proposition when Compared with Gaming Peers
2020P Enterprise Value (EV) / Adjusted EBITDA Multiples
2021P EV / Adjusted EBITDA Multiples:
Source: Capital IQ and Wall Street research as of 12/26/2019
Notes:
1. Gateway EV / Adjusted EBITDA multiple based on enterprise value implied by US$10.00 per share cost basis: 2020 (pre-IFRS 16) Adjusted EBITDA of C$195MM based on Gateway management projections excluding Non-Core Properties
2. Pro Forma for Great Canadian’s acquisition of Clairvest’s interest in the West GTA and GTA Bundles. Includes an estimated C$510MM and C$706MM adjustment for future estimated attributable capex spend at the West GTA and GTA Bundles in 2020 and 2021, respectively
3. Pro forma for the expiration of the Native American Management Fee
4. Includes $250MM of synergies
5. Includes $500MM of synergies
6


LOGO

Key Metrics Versus Selected “Locals” Comps
Superior Operating Metrics…
…At A Meaningful Valuation Discount
Strong Adjusted EBITDA Growth Profile
(19P-21P Expected CAGR)
Highly Attractive EV / Adjusted EBITDA Multiple
Superior Free Cash Flow Conversion
(2020P) (2)
Industry-Leading FCF Yield
(2020P) (3)
Source: All Projections for Red Rock and Boyd from Capital IQ and Wall Street research as of 12/26/2019
Notes:
1. Pro forma for the expiration of the Native American Management Fee
2. Free Cash Flow Conversion calculated as Adjusted Free Cash Flow divided by Adjusted EBITDA; Adjusted Free Cash Flow calculated as Adjusted EBITDA less maintenance capex and cash taxes
3. FCF Yield calculated as Adjusted Free Cash Flow divided by Enterprise Value; Adjusted Free Cash Flow calculated as Adjusted EBITDA less maintenance capex and cash taxes
7


LOGO

Backed by Marquee and Proven Gaming Investors
HG Vora
Highlights
US$5Bn+ event driven and value oriented investment firm founded in 2009
Invests opportunistically across the capital structure
Deep expertise in consumer and real estate sectors including gaming, lodging, leisure, retail, travel and specialty finance
Partnership with Leisure / Gateway
Post-transaction, HG Vora will have invested in excess of US$100MM in Gateway, including existing invested capital
In October 2019, HG Vora invested in the Company through a US$150MM HoldCo Term Loan
As part of the SPAC transaction, certain affiliated funds of HG Vora to provide US$30MM equity commitment
Pro forma for the transaction, HG Vora will own ~15% of the Company (1)
Catalyst Capital
Highlights
Founded in 2002, The Catalyst Capital Group is a Toronto based private equity investment management firm with C$6Bn in assets under management
The Catalyst team collectively possesses more than 110 years of relevant experience in restructuring, credit markets and merchant and investment banking in both the U.S. and Canada
Partnership with Gateway
Catalyst currently beneficially owns or manages ~74% of the outstanding common shares of the Company
Since acquiring Gateway’s equity in 2010, Catalyst has been committed to long-term sustainable growth and has been instrumental in the Company’s acquisition, renovation and rebranding initiatives
As majority owner, Catalyst has supported implementation of Gateway’s strong corporate and property operating teams, diversified growth initiatives, and industry-leading operating model which, over the last six years, led to doubling of locations and Adjusted EBITDA, increasing slot machines by 3x, increasing table games by 2x and adding 56 new F&B outlets across British Columbia and Ontario
Gabriel de Alba, Managing Director and Partner, currently serves as the Executive Chairman and Director of Gateway
Select Investments
Select Investments
Note:
1. Assumes no SPAC redemptions beyond the US$11.2MM redeemed on 11/26/2019 and full roll of HG Vora US$10MM Public Float


LOGO

Experienced Board
Gabriel de Alba
Executive Chairman
Currently serves as Gateway’s Executive Chairman and will continue in this role post-Transaction
Joined Catalyst in Oct. 2002 and has served as Director or Senior Officer of various Catalyst portfolio companies, including Frontera Energy Corporation, Geneba Properties and Cabovisão
Daniel Silvers
Vice Chairman
Long-time gaming sector operator and investor with extensive experience as an executive leader / director of multiple SPAC successor entities
Currently serves as Founder and Managing Member of Matthew Lane Capital Partners LLC, Chief Strategy Officer of Inspired Entertainment and Independent Director of Avid Technology, Inc.
Led prior SPACs through successful acquisitions and integration
Lorne Weil
Vice Chairman
Renowned leader in the gaming sector with extensive experience in leading prior SPACs through successful acquisitions and integration
Currently serves as Founder and Principal of Hydra Management, Executive Chairman of Inspired Entertainment and Non-Executive Chairman of Tecnoglass
Marc Falcone
Will serve as CEO and President of Gateway post-closing
Extensive industry experience in the gaming and leisure sectors in both corporate and financial advisory roles
Previously the Chief Financial Officer and Treasurer of Red Rock Resorts from Oct. 2015 to May 2017 and the Chief Financial Officer of Station Casinos LLC (Jun. 2011 – May 2017)
Lyle Hall
Previously President and Managing Director of HLT Advisory Inc. (Aug. 2005 – May 2017) and National Director of KPMG Canada’s Hospitality, Leisure & Tourism practice prior to his time at HLT Advisory Inc.
Intimately involved in the evolution of land-based casino gaming in Canada having advised senior management and the boards of most provincial gaming corporations
Olga Ilich
Has served as President of Suncor Developments Ltd. since Jul. 1997 and was an elected member of the Legislative Assembly of British Columbia from 2005 to 2009, serving as the Minister of Tourism, Sport and the Arts, and the Minister of Labour and Citizens’ Services
Extensive Board experience, having served most recently as the Chair of the Board of Destination Canada
Dr. Michael Percy
Currently serves as an Independent Director of K-Bro Linen Inc. and previously served as the Chief of Staff to Alberta Premier Jim Prentice from Sep. 2014 to May 2015
Experienced Board member, having served as a director for ATB Financial, Epcor Utilities Inc., Matrikon and Sawridge
Additional Directors
Two additional independent directors are expected to be appointed at or following the completion of the Transaction such that Gateway Board of Directors will be comprised of up to 9 members
9


LOGO

Section 2
Company Overview and Investment Highlights


LOGO

Leading Operator of Integrated Gaming and Entertainment Destinations
Gateway at a Glance (1)
One of the largest and most diversified gaming and entertainment companies in Canada
Owns and operates 25 leading gaming and entertainment venues across British Columbia and Ontario
British Columbia: Operates over 40% of all slot machines and table games
Ontario: Contractually exclusive service provider in the Southwest, North, and Central Bundles (as conducted and managed by Ontario Lottery and Gaming Corporation)
Demonstrated track record of successfully operating, developing and acquiring gaming properties and contributing to the communities in which Gateway operates
Consistently delivering on its organic growth initiatives and is well-positioned for the future with a strong growth pipeline of new development, renovation, and rebranding efforts
Defensible barriers to entry due to rigorous regulatory requirements, proven branding strategy and deep industry and operational expertise
High-quality locals-focused and resilient customer base
Proven and proprietary F&B and gaming offerings branded to market size, market growth potential and local community demographic
C$195MM 2020P Adjusted EBITDA
Company Snapshot (1)
Core Properties Across 2
Provinces
Slots
Tables
Hotels & Convention
Centers
F&B
Outlets
Employees
Robust Financial Growth Profile (1) (2)
Adjusted EBITDA (C$MM)
Notes:
1. Gateway Management Projections; excludes the Non-Core Properties. Projections rounded to the nearest million
2. Financials exclude Adjusted Property EBITDA for Non-Core Properties and are shown pre-IFRS 16. 2017 and 2018 figures include a C$35MM and C$6.9MM adjustment, respectively, for the Sale Leaseback transaction (“SLB Transaction”) in which Gateway sold the real estate of Grand Villa Casino Burnaby, Starlight Casino New Westminster and Cascades Casino Langley to a third-party on March 12, 2018
11


LOGO

Attractive and Diverse Property Portfolio
Recently Refreshed Properties with No Deferred Capex Spend
Point Edward, ON
Burnaby, BC
Rama, ON
New Westminster, BC
Kamloops, BC
Hanover, ON
Burnaby, BC
Burnaby, BC
Penticton, BC


LOGO

Investment Highlights
Gateway: Platform Positioned for Strong EBITDA Growth and FCF Generation
Geographically Broad and Economically Diversified Footprint
Unique and Attractive Regulatory Environment in Historically Resilient Markets
Operates in Highly Populated Markets that are Relatively Underpenetrated
Differentiated Business Model Expected to Drive Strong Free Cash Flow Conversion
Proven Branding Strategy Focused on Proprietary Offerings Tailored to Local Market
Highly Experienced Management Team with a Proven Track Record
13


LOGO

Geographically Broad and Economically Diversified Footprint (1)
British Columbia
Ontario (SW, N. and Cen.
Bundles)
Gaming Share
British Columbia
Managed competition limits new supply
Operates 5 out of the 7 casinos in the Thompson-Okanagan region
Contributes 49% of 2019P Adjusted Property EBITDA (4)
Ontario
Exclusive service provider within three bundles
In-place growth initiatives
Contributes 51% of 2019P Adjusted Property EBITDA (4)
Notes:
1. Excludes Non-Core Properties
2. Based on number of gaming positions in markets served. British Columbia gaming share based on the markets (Lower Mainland, Thompson-Okanagan and Vancouver Island) in which Gateway operates
3. Represents gaming share within the applicable bundle; Gateway currently operates 3 out of the 8 total bundles as conducted and managed by the OLG
4. Based on Gateway management projections; excludes the Non-Core Properties
14


LOGO

Unique and Attractive Regulatory Environment. . .
British Columbia
Ontario
Long-Dated
Operating Agreements / Licenses
Up to 20 Years
No license expiring prior to 2038
~20 Years (1)
Public / Private Partnership
High Barriers to Entry
Policies to manage competition between gaming properties; controlled implementation of new gaming positions
Operator exclusivity within each bundle
Limited Competition
Crown Agency Support
BCLC pays for all slots and maintenance capex
Modernization process designed to maximize property potential and drive total revenue
% of F&B, Entertainment and Other Revenue Retained by Gateway
100%
Gateway does not pay a gaming tax for F&B, Entertainment and Other Revenue generated at its properties
Long-Term
Stability and Visibility
Note:
1. Central Bundle operating agreement term of approximately 23 years
15


LOGO

in Historically Resilient Markets
Outperformance During Financial Crisis: Peak-to-Trough Decline (1)(2)
British Columbia
Ontario
Canada
U.S.
Total Core Gateway Markets
5 Largest Locals-Driven Markets (3)
Las Vegas Strip
Locals-Focused
Underpenetrated Markets
Diversified Across Geographies and Product Offerings
Notes:
1. Peak to trough decline is calculated as the percentage change between fiscal year 2010 and fiscal year 2008 for the Canadian markets and the percent change between calendar year 2009 and calendar year 2007 for the U.S. markets.
Canadian fiscal year end is March 31
2. From 2008 to 2010, all Ontario properties were still operated by the OLG
3. Five largest locals driven markets include Nevada (excluding contribution from Las Vegas strip), Pennsylvania, Louisiana, Illinois and New Jersey. Illinois data includes Video Gaming Terminals


LOGO

Operates in Highly Populated Markets that are Relatively Underpenetrated
Adult Population (MM) (1)(2)
Adults Per Gaming Position (1)(2)(3)
Gaming Spend per Adult (C$) (1)(2)(4)
Average of Top 5 U.S. Locals Driven Markets
British Columbia
Ontario
Gateway Markets:
Enormous Population Catchment
Underbuilt Casino Supply
Underpenetrated Player Demand
With the Recent Modernization Process, We Believe Ontario Represents the Greatest Growth Opportunity
Notes:
1. Adult population includes individuals ages 18 years and older; population statistics as of July 1, 2018 for Canada, December 2018 for United States
2. Top 5 U.S. locals driven markets include Nevada (excluding contribution from Las Vegas strip), Pennsylvania, Louisiana, Illinois and New Jersey; Illinois data includes VGTs (video gaming terminals) and Alberta data includes VLTs (video lottery terminals)
3. Gaming positions as of 3/31/2019 for Top 5 U.S. Locals Driven Markets, Ontario and British Columbia; table games includes poker tables and assumes six gaming positions per table
4. Gaming spend is presented for the last twelve months as of March 31, 2019. U.S. gaming spend assumes an exchange rate of $1.31 per US$1, representing the average exchange rate from April 1, 2018 to March 31, 2019
17


LOGO

Differentiated Business Model Expected to Drive Strong Free Cash Flow Conversion
Low Capital Expenditures and Existing NOL Balance Drive Strong Free Cash Flow Conversion (1); Free Cash Flow Used to Fund Growth Strategies and De-Lever
Characteristics Driving High Free Cash Flow Conversion
Lower Maintenance Capex
~C$20-30MM per year saved on slot machines
Lower maintenance due primarily to BCLC purchase and maintenance of slots (2)
Large Existing NOL Balance
Current NOL balance of C$375MM as of 9/30/19
2019P Adjusted Free Cash Flow (3) (4)
Notes:
1. Free Cash Flow Conversion defined as Adjusted Free Cash Flow divided by Adjusted EBITDA (excl. Adjusted Property EBITDA for Non-Core Properties)
2. Gateway Management estimate of equipment and maintenance savings based on a six year refresh cycle
3. Adjusted free cash flow calculated as Adjusted EBITDA less maintenance capex and cash taxes
4. Gateway Management projections rounded to the nearest million
5. Great Canadian excluded from peer set due to lack of maintenance capex publication
6. Assumes $500MM in synergies
7. Cash taxes for MCRI uses LTM 6/30/18 as proxy for 2019P
EV / 2020P
Adjusted EBITDA
2019P Free Cash Flow Conversion vs. Peers (3) (4) (5)
18


LOGO

Proven Branding Strategy Focused on Proprietary Tailored Offerings
Integration of Proprietary F&B Offerings within Existing Casinos Has Driven Consistent Increases in Annual Revenue, Including Strong Growth in Gaming Revenue
GAMING BRANDS
Urban market focus
Premium
Stylish
Urban market focus
Contemporary
High energy
Community focused
Casual
Approachable
Community focused
Neighborly
Relaxed
FOOD & BEVERAGE BRANDS
Modern steakhouse
Elevated
Memorable
Creative pub food
Lively sports bar
Welcoming
Authentic Asian flavors
Exciting
Interactive
Variety
Great Value
Casual
Modern supper club
Showcase theatre
Vintage cabaret
THE RIGHT FIT
FOR THE RIGHT MARKET
Assigning Brands to Markets
Market size and growth
Brand proximity
Local character
Competitive Advantages
Tailored customer experience
Speed to market
Loyalty builder


LOGO
6 Highly Experienced Management Team with a Proven Track Record Marc Falcone to Lead Gateway as President and CEO to Further Accelerate its Growth Strategy
Professional Experience
Marc Falcone Chief Executive Officer and President
Sightline Magnetar Capital Deutsche Bank Goldman Sachs
Will replace retiring CEO, Tony Santo, as Chief Executive Officer and President of Gateway Casinos
Highly respected executive with extensive experience in the gaming and leisure sectors in both corporate and financial advisory roles
Currently serves as President and Chief Financial Officer of Sightline Payments LLC, a digital commerce platform for the gaming industry, and as a member of LACQ’s Board of Directors since Dec. 1, 2017
Previously served as CFO and Treasurer of Red Rock Resorts and Station Casinos (Jun. 2011 – May 2017). Oversaw a ~600% increase in the equity value of Red Rock Resorts during his tenure at the Company ($2.8Bn in May 2017 vs estimated $400MM in Jun. 2011)
Served as the Chief Financial Officer of Fertitta Entertainment from Oct. 2010 though May 2016
Prior experience also includes Goldman Sachs & Co., where he focused on restructuring transactions in the hospitality and gaming sectors, Magnetar Capital, Deutsche Bank and Bear Stearns
Notes:
1. Ms. Kormos previously was a consultant of the Company for 2 years assisting with the development of Gateway’s bids under the Ontario modernization process
2. Mr. McInally previously was a consultant of the Company for 2 years assisting with the development of Gateway’s bids under the Ontario modernization process
Supported by an Existing Management Team with Industry Expertise, Deep Relationships and 125+ Years of Experience
Tolek Strukoff, Chief Legal and Administrative Officer 3+ Years at Gateway | 11+ Years of Experience (Lawson Lundell LLP, UrtheCast, Westport Fuel Systems)
Carrie Kormos, Chief Marketing and Communications Officer 3+ Years at Gateway(1) | 18+ Years of Experience (Caesars Windsor, Fallsview Casino Resort & Casino Niagara – consultant advisor, Magna Entertainment)
Terry McInally, Chief Compliance and Risk Officer & Chief Information Officer 2+ Years at Gateway(2) | 20+ Years of Experience (Richter Advisory, PwC, AGCO)
Robert Ward, Chief Operations Officer
6+ Years at Gateway | 20+ Years of Experience (Points West Hospitality, Sequoia Enterprises, Keg Restaurants)
Queenie Wong, Chief Accounting Officer
8+ Years at Gateway | 14+ Years of Experience (PwC)
Jagtar Nijjar, EVP, Development and Construction
23+ Years at Gateway | 25+ Years of Experience
Scott Phillips, SVP, Human Resources 6+ Years at Gateway | 20+ Years of Experience (JD Sweid Foods, Sodexo Canada, Abitibi-Consolidated, TimberWest)
Hargo Roopra, SVP, Operations and Marketing Analytics
11+ Years at Gateway | 11+ Years of Experience
Michael Snider, SVP, Legal Affairs
3+ Years at Gateway | 13+ Years of Experience (Westport Fuel Systems, Lawson Lundell LLP)
Jamie Papp, SVP, Casino Operations
2+ Years at Gateway | 22+ Years of Experience (Mirage Resorts, Wynn Resorts, American Gaming Systems, Caesars Entertainment)
20


LOGO
Section 3
Proven Growth Platform
21


LOGO

Strong Track Record of Successful Capital Allocation
Series of Expansions, Acquisitions, Relocations and New Builds Have Generated Attractive Historical Implied ROICs
Capex is Driving Strong EBITDA Growth… (1)
Adjusted EBITDA; 2016 – 2022 (C$MM)
2016-2022P: 26% CAGR
2016–9/30/19 LTM: +C$98MM (Incremental Adjusted EBITDA from Growth Capex) (2)
9/30/19 LTM–2022P: +C$55MM (Incremental Adjusted EBITDA from Growth Capex) (2)
C$62
C$116
C$163
C$173
C$174
C$195
C$215
C$250
Growth
CapEx
(C$MM)
19
198
146
146(5) 145
191
104
13
Notes:
1. Adjusted EBITDA is shown pre-IFRS 16 and excludes Adjusted Property EBITDA for Non-Core Properties. Adjusted EBITDA includes a C$35MM, C$35MM and C$6.9MM pro forma adjustment for the SLB Transaction in 2016, 2017 and 2018, respectively. Projections rounded to the nearest million
2. Accounts for illustrative compounded annual organic Adjusted EBITDA growth of 3% from (i) 2016 – 9/30/19 for the historical implied ROIC calculation and (ii) 9/30/19 – 2022 for the projected implied ROIC calculation
3. Historical ROIC is defined as Incremental Adjusted EBITDA from growth capital expenditures generated between 9/30/19 LTM and 2016 divided by cumulative growth capital expenditures spent between 2017—9/30/19 LTM
4. Projected ROIC is defined as projected Incremental Adjusted EBITDA from growth capital expenditures generated between 2022 and 9/30/19 LTM divided by cumulative growth capital expenditures spent between Q4’19—2022
2019 YTD (through 9/30) growth capex is C$115MM
and Attractive Returns
Historical
Projected
Growth Capex (2017-9/30/19): C$459MM
Incremental Growth EBITDA: C$98MM (2)
Growth Capex (Q4’19-2022P): C$338MM
Incremental Projected
Growth EBITDA: C$55MM (2)
Historical Implied
ROIC (3):
21%
Projected Implied ROIC (4):
16%
22


LOGO
Completed Investments in British Columbia Position Gateway to Capture Immediate Returns
2018 and 2019 Completed Projects
Burnaby
Completed:
September 2019
Project Cost:
C$22MM
Expansion of gaming space
Opened Atlas Steak + Fish and Chow Lucky Noodle Bar
Added an incremental 130 machines in Sep. 2019 to bring the total to 1,330 at the site
Added a Pulse gaming arena with 35 units
Delta Hotel renovation
Refresh and relocation of the poker room, hotel lobby and high limit room
Langley
Completed:
July 2019
Project Cost: C$19MM
~12k sq. ft. added
Increased slots by 75 (50 were installed in 2018) and tables by 3
Expanded Match Eatery & Public House by adding a patio in 2018, and added Atlas Steak + Fish in 2019
Refresh of Coast Hotel, convention center and ballroom
Projected Adjusted Property EBITDA (C$MM) (1)
CAGR: 8%
C$36
C$41
C$43
CAGR: 5%
C$24
C$25
C$26
Note:
1 Adjusted Property EBITDA figures shown pre-IFRS 16
23


LOGO

Growth-Oriented Ontario Modernization Process…
In March 2012, the OLG announced its modernization process with the aim of attracting private partners to invest in and operate facilities across the province
Public-Private Partnerships
Working with strong operators to bring world-class operating strategies to casinos across the province
Revenue Optimization
Maximize property potential and drive total revenue
Bundle Exclusivity
Operators’ bundles provide each with exclusivity and exclusive right to develop new sites for a fixed period of time
Realign with Population Centers
Relocate facilities in rural areas to denser population centers (1)
Add table games to enhance appeal to younger patrons (1)
Modernize gaming technology in-line with current industry standards
Operators keep 100% of all F&B and other non-gaming revenue, driving investments in new venues within facility
Table Games Technology Inective for non-gaming Amenity Investment
Note:
1. Subject to contractual approvals from Crown agencies and other required approvals
24


LOGO

has Created a Unique Growth Opportunity in Ontario
SAULT STE MARIE
ONTARIO
TORONTO
NIAGARA
LONDON
OTTAWA
WINDSOR/ DETROIT (US)
KENORA
WESTERN ONTARIO
THUNDER BAY
Greater Southern Ontario has a total population of 12.7 million
Three largest North Bundle cities have populations of 75,000 to 165,000
Innisfil (and surrounding area) in Central Bundle has population of ~200,000
London in Southwest Bundle is a city of ~500,000
Limited competition between bundles
Current Gateway Property
Anticipated Future Gateway Property
Non-Gateway Property
North Bundle
Central Bundle
Southwest Bundle
Population Density (km 2)
0 – 0.1
0.1 – 0.25
0.25 – 0.5
0.5 – 1
1 – 2.5
2.5 – 5
5 – 10
10 – 25
25 – 50
50 – 100
25


LOGO

Ability to Generate Additional Growth Through Infrastructure and Operational Expertise
Since acquiring the Ontario Bundles, management has continued to implement a number of operational initiatives to increase revenue and reduce costs
Slot
Operations
Refreshed and reconfigured slot floors to increase revenue by introducing more current product / titles and better product mix
Marketing
Programs
Overhauled marketing programs by introducing proven BC programs and data analytics while eliminating ineffective legacy programs
Marketing
Efforts
Modified reinvestment to reflect local market conditions including eliminating cash-back, introducing “must be present to win” for draws and deploying weekly offer program to drive visitation
ATM
Incorporated ATM machines into existing contracts and increase fee per ATM transaction
Restructured pension program to provide a similar level of benefit as provided by the OLG at a lower cost
Pension
Programs
Right-size staff and optimized the use of part time labor
Labor
Leveraged existing F&B supply contracts to increase buying power and reduce food and beverage costs
F&B
26


LOGO

Section 4
Executing on
Multiple Growth
Initiatives


LOGO

Near-Term Identifiable Growth Strategies
Future Planned Capex Expected to be Funded from Cash on Hand and Free Cash Flow Generated
Growth Capital for Renovation, Rebranding and Redevelopment from 2016 – Q3’19:
C$479MM
Q4’19 – 2022 Planned Future Growth Capex:
C$338MM
1
Ongoing Deployment of Proven Strategies at Ontario Properties
Renovations (1)
Slots
Tables
F&B-Branded Outlets
+676
+111
+12
2
Drive Multi-Year Growth Pipeline in New Ontario Markets and Relocations in BC
New Builds / Relocations (1)
Slots
Tables
F&B Branded Outlets
+1,450
+40
+9
Note:
1. Gaming expansion figures as of January 23, 2020
28


LOGO

1

Ongoing Deployment of Proven Strategies at Ontario Properties
Point Edward
(SW)
Gateway Innisfil (Central)
Hanover
(SW)
Chatham (SW)
London (SW)
Sudbury
(North)
Completed: November 2018
C$28MM Spent
Renovation of existing gaming facility and rebranding as a Starlight Casino
Added 48 slot machines
Added a MATCH Eatery & Public House and The Buffet
Completed:
February 2019
C$5MM Spent
Added 3,600 gaming sq. ft. and 123 slot machines
Added live gaming with the addition of 26 tables (previously none)
Completed: April 2019
C$22MM Spent
Relocated existing gaming facility to adjacent building and rebranded as Playtime
Added 8,225 gaming sq. ft., including 111 slot machines and 8 tables (previously none)
Added a MATCH Eatery & Public House and The Buffet
Completed: August 2019
C$36MM Spent
Relocated from Dresden (population of ~2.8k) to Chatham (population of ~40k)
Branded as a Cascades Casino
Constructed ~44,600 sq. ft. new facility with ~28,600 sq. ft. gaming floor including 136 incremental slot machines, 10 tables (previously none), a MATCH Eatery & Public House and The Buffet
Q3’21
C$3MM Spent
C$72MM Future
Spend
New, Starlight-branded facility relocated to London
Constructing ~103,000 sq. ft. facility with ~67,000 sq. ft. gaming floor (3) including 133 slot machines and 38 tables (8 added in 2019)
Adding 4 F&B outlets (Atlas Steak + Fish, MATCH Eatery & Public House, The Buffet and CHOW Noodle Bar)
Q1’22
C$4MM Spent
C$56MM Future
Spend
New, Starlight-branded facility expected to be located near to downtown Sudbury
Constructing ~64,200 sq. ft. facility with ~41,000 sq. ft. gaming floor (3) including 173 slot machines, 21 tables (previously none) and 2 F&B outlets (MATCH Eatery & Public House and The Buffet)
Notes:
1. Gaming expansion figures as of January 23, 2020
2. Future expansion is subject to contractual approval from Crown agencies and other required approvals
3. Gaming square footage includes back of house area
Aggregate
Expansion (1)
Completed
Future (2)
SLOT
MACHINES
+370
+306
ADDITIONAL
TABLES
+52
+59
F&B BRANDED
OUTLETS
+6
+6
29


LOGO

Multi-Year Growth Pipeline in New Ontario Markets and Relocations in BC
Expected New Developments and Relocations
New Markets
Relocations
North Bay, Ontario
To be branded as a Cascades Casino
New ~38,900 sq. ft. facility with ~27,700 sq. ft. gaming floor including 300 slot machines and up to 10 table games (2)
Adding 2 F&B outlets, including a MATCH Eatery & Public House and The Buffet
125 km from the proposed Sudbury facility
Wasaga Beach, Ontario
To be branded as a Playtime Casino
New ~24,900 sq. ft. facility, with ~16,300 sq. ft. gaming floor (2)
Expected to have up to 250 slot machines
Adding a MATCH Eatery & Public House
Kenora, Ontario
To be branded as a Playtime Casino
New 23,300 sq. ft. facility with ~17,000 sq. ft. gaming floor with up to 200 slot machines (2)
Adding a MATCH Eatery & Public House
Delta, British Columbia
To be branded a Cascades Casino
~40,000 gaming sq. ft. including 500-600 slots and 30 table games (2)
Adding 3 F&B outlets, including a MATCH Eatery & Public House and The Buffet and a future Atlas Steak + Fish
To engage a third-party to build and operate a hotel at the property (in process)
Mission, British Columbia
Relocate to a new ~33,400 sq. ft. facility with ~21,500 sq. ft. gaming floor (2)
Planned increase of up to 100 slots
Adding MATCH Eatery & Public House and The Buffet
Q3’20
C$7MM Spent
C$26MM Future Spend
Q3’21
C$2MM Spent
C$27MM Future Spend
Q1’22
C$2MM Spent
C$19MM Future Spend
Q4’21
C$6MM Spent
C$81MM Future Spend (3)
Q3’21
C$1MM Spent
C$9MM Future Spend
SLOT MACHINES
+1,450
Aggregate Expansion (1)
TABLES
+40
NEW F&B - BRANDED OUTLETS
+9
Notes:
1. Gaming expansion figures as of January 23, 2020
2. Based on preliminary project plan; actual gaming square footage may differ. Gaming square footage includes back of house area
3. Projected budget includes C$15MM in cost savings through value engineering and provided BCLC and municipal authorities consent to any changes to the design, to the extent such consents are necessary. An additional C$5MM in savings is targeted which could further lower the total remaining spend to a projected C$76MM
30


LOGO

Section 5
Appendix


LOGO

Gateway’s Financial Summary (2017A – 2022P)
Total Revenue (1)
(C$MM)
18-22P
CAGR: 12%
C$448
C$657
C$788
C$865
C$929
C$1,037
Adjusted EBITDA (1)
(C$MM)
18-22P
CAGR: 11%
Began Operating Southwest and North Bundles
(May 2017)
C$116
Began Operating Central Bundle
(July 2018)
C$163
C$174
C$195
C$215
C$250
25.9%
24.8%
22.1%
22.5%
23.2%
24.1%
92%
95%
86%
91%
90%
92%
Projected Free Cash Flow Conversion % (2)
Source: Gateway Management Projections


LOGO

Prudent Capital Structure
12/31/2019P Pro Forma Capitalization (C$MM) (1) (2)
Growth Strategies Expected to be Funded from Cash on Hand and Free Cash Flow Generated
Future Free Cash Flow to be Used to De-Lever the Business
Notes:
1. 12/31/19 figures shown are as projected by management and are unaudited
2. Pro forma capitalization assumes no redemptions beyond $11.6MM redeemed on 11/26/2019
3. Senior Secured Notes are callable in March 2020
4. Excludes cage cash of C$62MM
33


LOGO

Adjusted EBITDA Reconciliation
Note:
1. SLB Transaction adjustment not included in financial statements
34